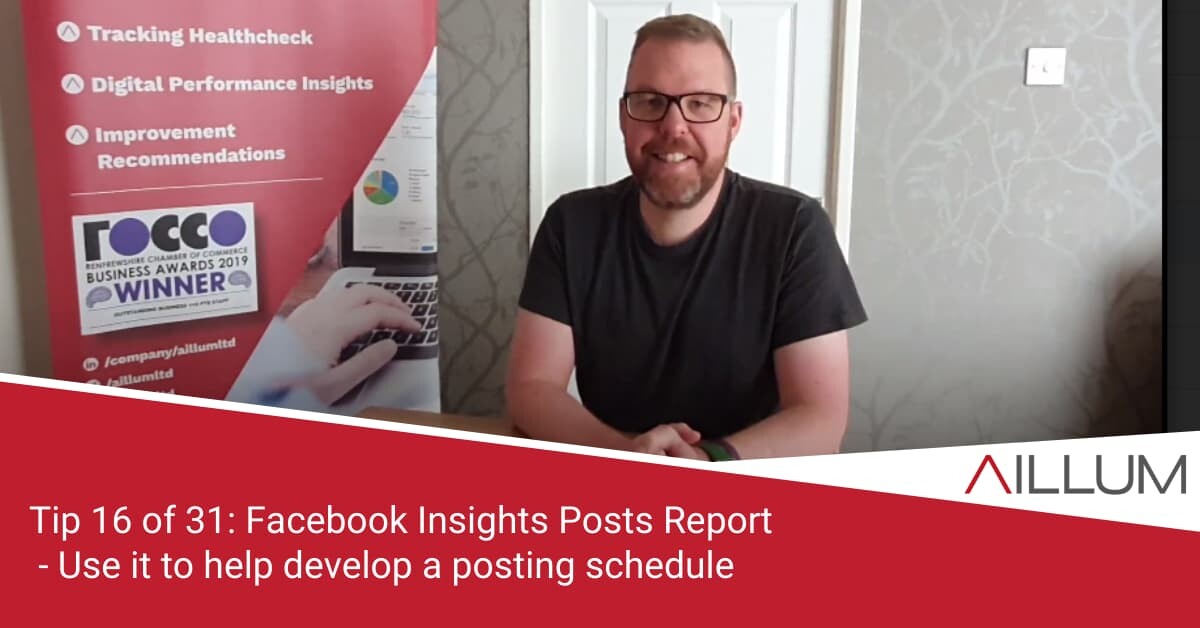
Over the years we’ve seen a lot of hands go up when we ask who uses Facebook for business, but not so many go up when we ask who uses Facebook Insights – the analytics behind your activity. So tip 16 is all about trying to get you starting to look, by introducing the Posts Insights report.
To keep up with all 31 tips, visit the full list here, or join the newsletter for a weekly summary email, or follow us on your preferred social channel: LinkedIn, Facebook, Twitter, Instagram, Pinterest or subscribe to our channel on Youtube.
What Is Facebook Insights?
Facebook Insights is the reporting section behind your Facebook Business Page. We know staring at data / analytics isn’t everyone’s idea of fun, but we’d recommend you do start getting familiar with Facebook Insights. It CAN help you improve your Facebook use.
The volume of information it provides has grown over the years, and includes data such as:
- Days and Times of Day your followers are online.
- Average Reach & Engagement comparisons of posts types: Video, Images.
- Total Views of your Facebook Page (not just your posts in other peoples feeds)
- Age, Gender and Location data of your followers and those your posts reach.
- Reach, Comment, Share metrics.
And a lot more!
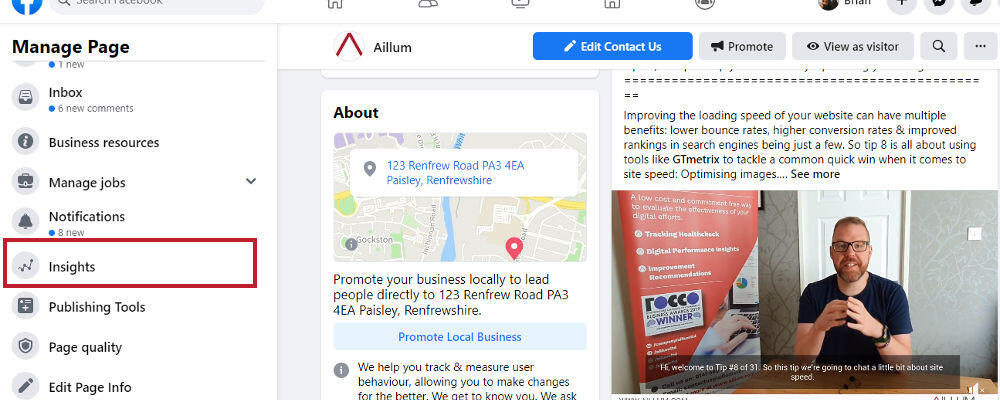
It can be a little overwhelming if you’ve not used it, so we recommend starting a report at a time. One of the best reports to start on is the Posts report.
Why Is The Posts Report Important?
The data provided within the posts report can help you better understand when the best times to post on Facebook might be. It makes this possible by offering:
- A report detailing which days, and times of day, your followers are online.
- A report detailing which days / times you posted, and the Reach & Engagement rate of those posts.
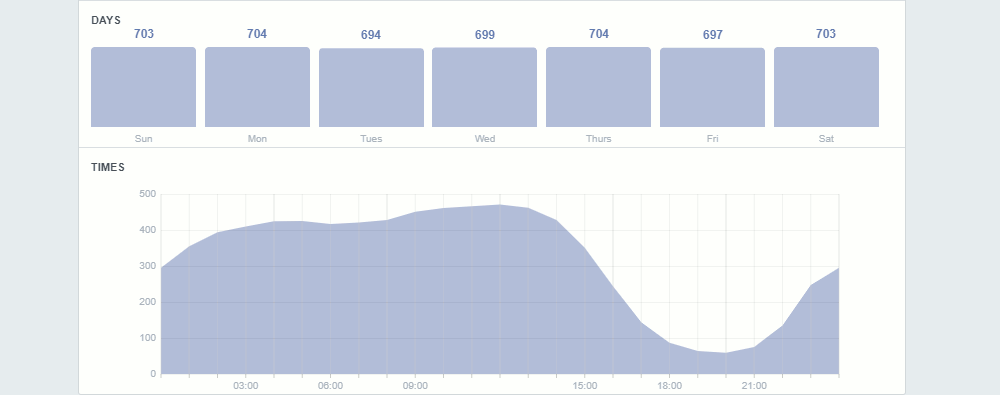
Now, it doesn’t tell you exactly when the best time to post is. That would make it too easy. You’ll instead have to do some note taking to try and work it out by looking for patterns and trends.
The Post report is important because you can then take those patterns / trends and try some test posting schedules, hopefully making your Facebook Page management more efficient, and more rewarding.
What Data Will The Posts Report Give Me?
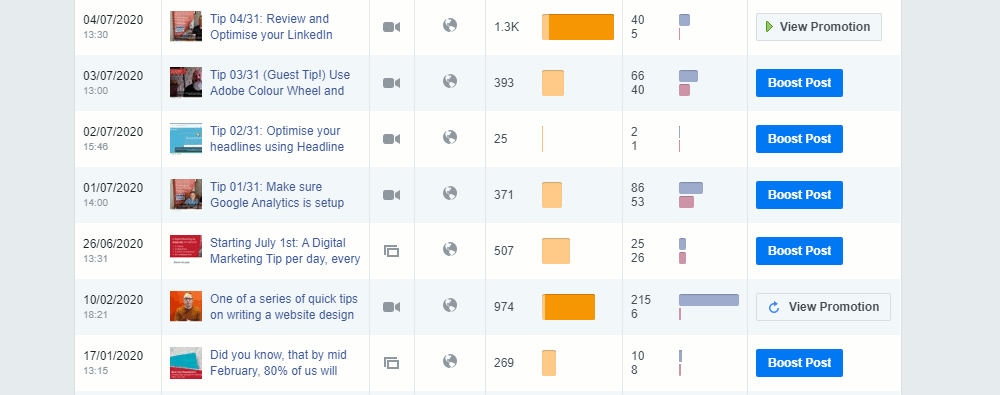
The main Posts report table offers a lot of information, including:
- Day / Time of Day of the post.
- Intro text / image from post (to remind you what it was)
- The type of post (Video, Image, Link)
- The reach achieved by the post.
- Engagement levels of the post.
The data within the final Engagement column can be altered to display different types of engagement and engagement rate.
[templatera id=”3898″]
What Patterns should you try and find?
It won’t always be obvious. Other factors impact on post reach and engagement (quality of post, image used, text within post, volume of posts etc), but you’re specifically looking to try and find patterns such as:
- Are there certain times in a day that appear to generate greater reach and / or engagement levels than others?
- Are there certain days that generated greater reach and / or engagement?
- Are there specific post types, or content of posts, that generate greater reach and / or engagement?
If you do find a pattern, could you now test those days, times and content types to see if it’s a genuine trend?
As mentioned, other factors can influence the performance of your post, so you may not always see a pattern … but, we always recommend page owners use this report just incase.
There might be a pattern there, and you might be able to take advantage of that and schedule future posts for similar days / times to increase overall reach.
Browse all 31 tips
To catch up on all 31 Digital Marketing Tips from this series, head over to the main blog post.
