You send out mailshots, write content for blogs, post on multiple social channels and spend money on paid adverts, but do you know which channels are most effective in driving conversions for your business? Tip 20 focuses on a Google Analytics report designed to help you better understand!
To keep up with all 31 tips, visit the full list here, or join the newsletter for a weekly summary email, or follow us on your preferred social channel: LinkedIn, Facebook, Twitter, Instagram, Pinterest or subscribe to our channel on Youtube.
Why is the Source / Medium Report so Important?
The Source / Medium report is just one of many useful reports in Google Analytics. We know Google Analytics can be tough to learn while also trying to run a business, but the data it offers can prove incredibly useful.
The Source / Medium report is a great place to get started as it offers you direct feedback on the performance of your various marketing channels.
Whether it be social media, email marketing, organic search, paid adverts or banners on other websites, the Source / Medium report, amongst other insights, can tell you:
- How much traffic came to the website from each source.
- Which of those traffic sources is most likely to result in conversions (enquiry forms, transactions).
- Which is most likely to result in key interactions (downloads, video plays and button clicks etc).
- Which is most likely to keep people on the website, and for how long.

How can you use the data within the Source / Medium Report?
There are multiple ways you could use this report. To get you started and more familiar with Google Analytics, we recommend using it initially to try and put some sort of prioritisation on your marketing activity.
Better understanding which marketing channels work, and which don’t, can help you better plan to:
- Focus more of your time and effort on the channels most likely to deliver a return.
- Review / Investigate the channels which aren’t performing as expected – and get them working.
It’s important that your digital marketing activity isn’t driven solely by the channels you like using, but by the channels that deliver for your business.
Where is the Source / Medium Report?
If you followed tip 01 in our series (Tip 01: Make sure Google Analytics is setup and running on your Website), you should now have access to a Google Analytics account for your website.
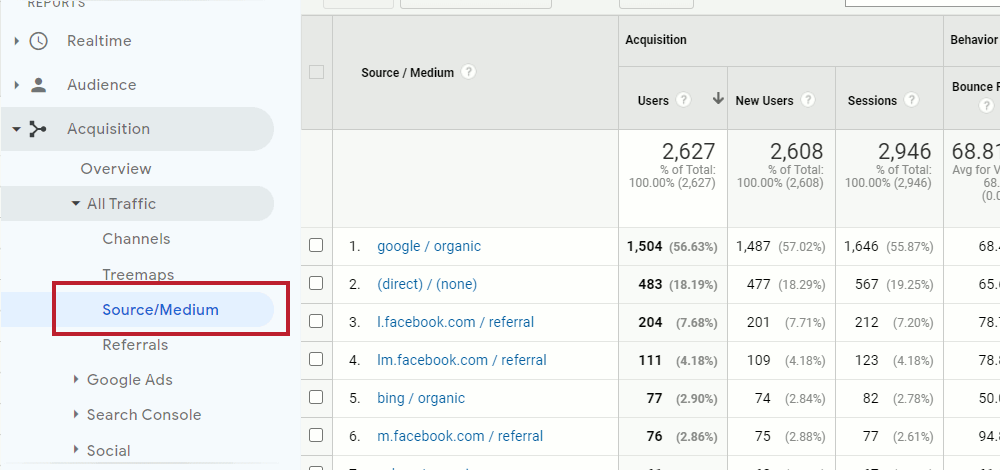
If so, login. There is a menu to the left of the interface. Click through to Acquisition > All Traffic > Source/Medium.

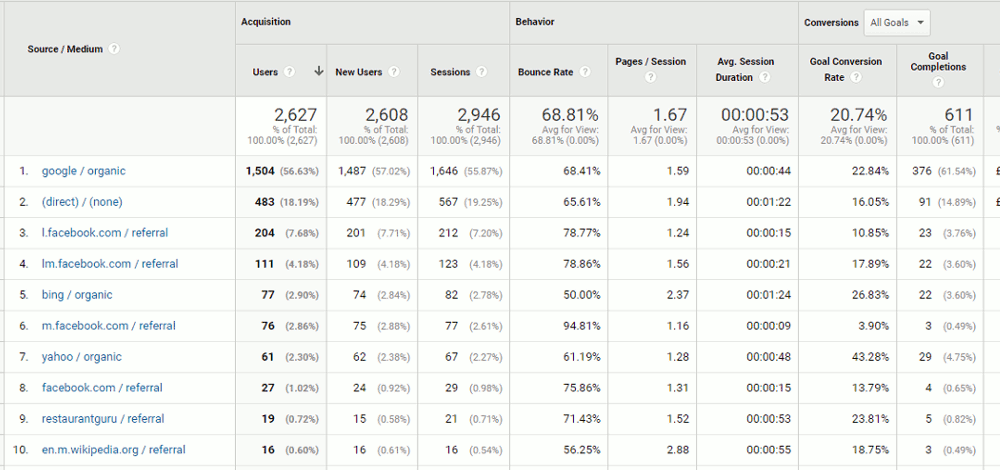
Depending how long your account has been live, and how much traffic your website receives, you should now see a table of traffic sources, with multiple columns including Bounce Rate, Sessions and Conversion Rate.
[templatera id=”3898″]
A Quick Exercise:
Ignoring Google Analytics for a few minutes, start noting down the various marketing channels you use and, where possible, a note of the time per day / week and any costs. Perhaps do this for a recent approx 2 month period.
You’re notes might look something like:
- Instagram: 4 posts per week (approx 30mins pw / 2hrs per month): £0 cost, just time.
- SEO: 2 new blogs per month (approx 3hrs per month): £0 cost, just time.
- Google Ads: Outsourced: £XX management fee per month + £XXX Clicks spend per month.
Nothing overly complicated … but you’ll be able to start ordering by cost or time, whichever you deem most important.
Now open up the Source / Medium report and select the same 2 month period from the date selector. How does your list compare to the order in the Source / Medium report?
- Are the channels you’re spending most time on, the same channels bringing in conversions?
- Are there channels performing well that you’re not spending much time on?
- Are the paid traffic sources keeping people on the site, or are they bouncing off?
There’s no exact answer, but you can see how it helps raise questions for your current activity. Perhaps it’s time to review!
Your own Context is Important!
We appreciate not every business or marketing channel is the same. We also know that you might be using different channels for specific purposes – brand awareness, newsletter signups etc, which in turn will influence how you interpret the data.
With that in mind, you need to ensure you take account of your own context when using this report and others.
Browse all 31 tips
To catch up on all 31 Digital Marketing Tips from this series, head over to the main blog post.


