Last month (Oct 2020) Google Analytics 4 officially launched and brought with it a significant amount of changes to how data is reported. The current version of Google Analytics (Universal Analytics) is still available at the moment and still works but the future looks to be Google Analytics 4.
With that in mind, here are 5 key differences in Google Analytics 4 (compared to Universal Analytics) that we think you should be aware of.
1. Standard Reports
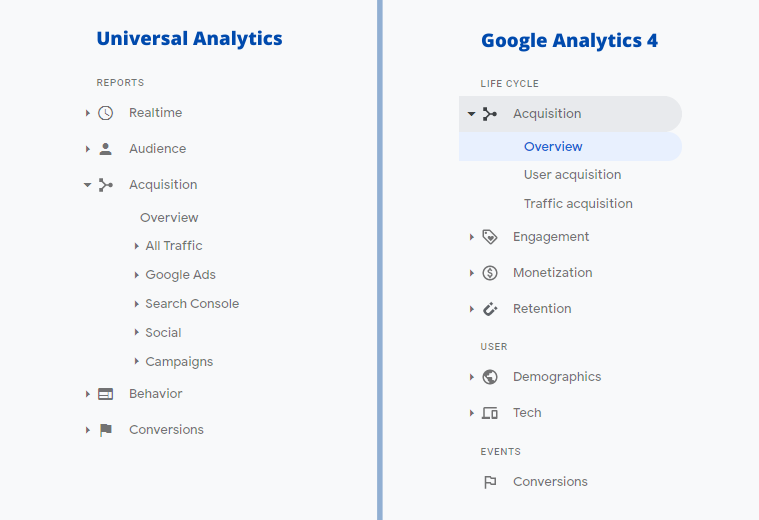
One of the most obvious changes in Google Analytics 4 is to the standard reports menu you would see listed on the left of the screen. Many of the reports from Universal Analytics have been removed, merged or reworked to make use of how data is collected in Google Analytics 4.

At the time of writing, there are only a handful of reports available. Google Analytics 4 has only just been released, so more reports may be added in the future as it receives further updates.
Once you have your Google Analytics 4 property set up, explore the reports at your leisure to get familiar with the new structure and how the reports display data now that events have been completely revamped.
2. Events
One of the core changes is in how events work. Within Universal Analytics, events are a special kind of ‘hit’ (action on the website) that sends data when a specific action is performed (clicking on a button, for example).
Such data is collected within an Event Category, Event Action and Event Label which can be filtered in reports to measure performance and impact of those events.
This is a very meaningful update to events as it allows you to perform some incredibly detailed reporting.
In Google Analytics 4 however, ALL ‘hits’ and interactions are considered events, even page views, and instead send a list of parameters as data to Analytics. This allows events to send significantly more relevant data along with every action.
It might sound technical, but there is good news! In Universal Analytics you have to manually setup event tracking. In Google Analytics 4, a number of events are automatically collected!
When setting up your new GA4 property, the default settings mean the following will automatically be tracked as events for you:
- Page Views
- Clicks
- File Downloads
- Scrolls
- User Engagement
- Video Engagement
Each of these events comes with its own set of parameters that can record metrics for each event. This is a very meaningful update to events as it allows you to perform some incredibly detailed reporting.
For example, a video engagement event can include data on the video title, video duration, video provider, video url, whether or not the video is visible, and more.
Custom events can also be sent to Google Analytics 4, as they could in Universal Analytics, but the setup process is different. Thankfully Google Tag Manager now includes a GA4 Events Tag where you can set up your own events with custom parameters and fire that data over to Google Analytics 4.
3. Bounce Rate
After being a staple metric in Google Analytics for many years, Bounce Rate has been replaced by a new metric called Engagement Rate in Google Analytics 4.
While this will be a change to get used to, we consider Engagement Rate to be a direct upgrade to Bounce Rate. It gives you more useful information about users who stay and interact with your website, rather than just how many visitors left.
You may discover users you thought were bouncing were actually engaging with your website before leaving.
An example, in Universal Analytics if a user arrives on your website and reads your latest blog post or news article and then leaves, they’d typically be recorded as a bounce and analytics would report nothing useful happened. This doesn’t show the whole picture and Engagement Rate is Google Analytics 4’s solution to this problem.
Engagement Rate itself will record a visitor as being “engaged” if they meet any of the following criteria, even if they only visit a single page on your website.
- Interacted with your website (in the foreground, being minimised or off-screen won’t count) for 10 seconds or more.
- A conversion event is fired, marking that a business objective was met on the page.
- The user records 2 or more page views, which is the current definition of “not bouncing”.
A very basic way to understand it is that engagement rate can be considered the inverse of Bounce Rate. If you had a Bounce Rate of 70% then you can expect an Engagement Rate of at least 30% in GA4 if everything is set up correctly.
In reality it’ll probably be a little higher, as you may discover users you thought were bouncing were actually engaging with your website before leaving. It will take time to adjust to this new metric in your reports, but you may find out that some of your pages have been performing better than you think!
Free Digital Tips Direct to your Inbox!
Be among the first to receive tips, advice and news on all things digital performance related. From new features in Google Analytics, Data Studio and other tools, to interesting articles, videos and more! Completely Free! (Unsubscribe any time you like!)
4. Pathing
Analysing user journeys through your website has become a whole lot easier thanks to the inclusion of the Analysis hub in Google Analytics 4, previously only available to Google Analytics 360 customers.
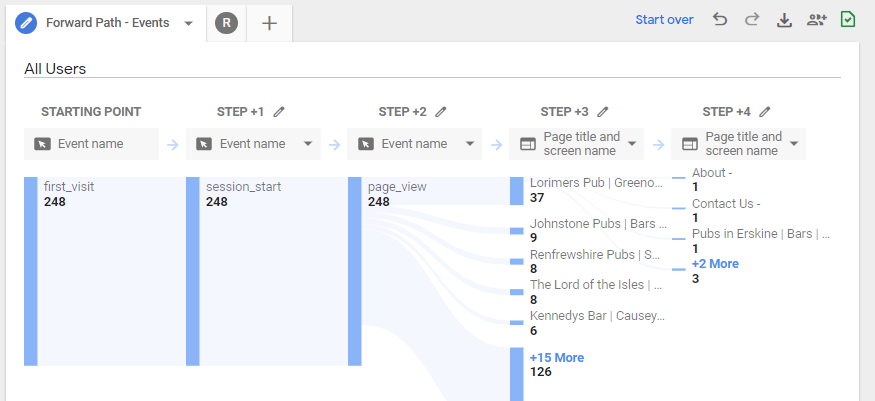
Within the Analysis Hub, it’s now possible to create a Path Analysis to get a direct view of how your users are navigating through your website.
Not only that, with filters available for the new events system, you can identify exactly what your users are doing as they move around pages. This makes it much easier to find which paths drive conversions on your website, as well as making it easier to find any problems.

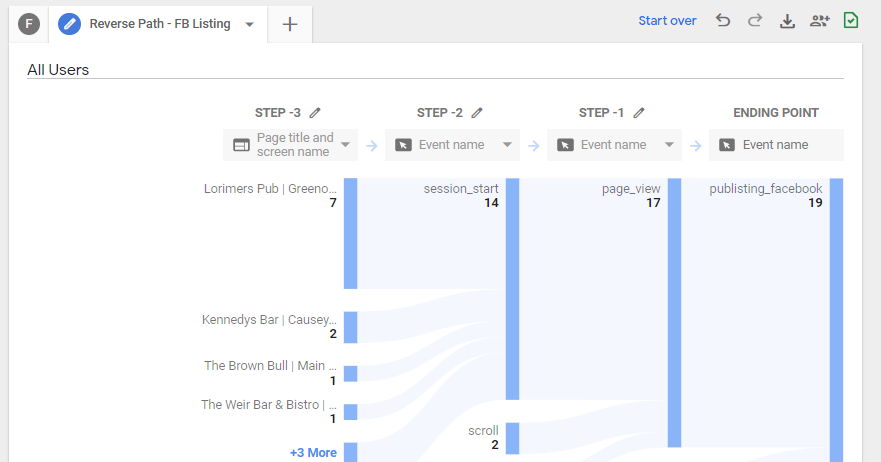
Not only that, it’s now possible to create backwards pathing. Do you have a conversion or objective in mind and want to see how users get there? You can set the final event and path backwards through the steps your visitors took to get there.

Both of these pathing options have a number of benefits, such as:
- Identify potential landing page improvements – do all of your facebook clicks come from a single page? Can you make it better?
- What pages to place calls to action – are some pages not generating conversions?
- Spot page issues, such as bottlenecks – are users suddenly stopping their journey at a certain page?
These are a few examples and are just the tip of the iceberg. If you have your Google Analytics 4 property set up already, dive in and begin experimenting with the pathing tools for yourself to see what you can find.
5. Conversions
Goals are a very useful feature in Universal Analytics as we have talked about in the past but traditional Goals have been removed from Google Analytics 4 and are now all referred to as Conversions.
With every interaction now being recorded as an event in Google Analytics 4, Conversions are all measured by the triggering of an event.

Every event in Google Analytics 4 can be toggled on as a Conversion to track meaningful objectives.
While there is an event goal already available in Universal Analytics, what happens to other goal types, such as destination goals (often used to track form submissions)?
Existing destination goals will require custom events to be created, whether directly in Google Analytics 4 or via Google Tag Manager. Don’t worry though. These are fairly simple to setup via Google Tag Manager.
It all might seem a bit more technical, but due to the depth of the new event system in Google Analytics 4, you can set up some incredibly detailed and specific Conversion events to accurately measure your online performance objectives.
Looking forwards…
Google Analytics 4 is not just a new version of Universal Analytics, it’s a big upgrade at the fundamental level by adopting an event-driven approach to reporting data. It’ll take time to get used to the new layout, features and technical details of how it all works.
You should be OK to continue using Universal Analytics for the foreseeable future, but we recommend you get a Google Analytics 4 property set up and added to your account, to run alongside your existing Universal Analytics.
If you’re not using Analytics for your business yet or don’t know where to start, check out our Analytics Starter Pack and get started today.


