Organisations unrelated to us often come to us once they’ve encountered problems online, from a drop in traffic or conversions to a drop in performance of specific marketing channels. Our initial questions often have a single focus, what changes were made?
More often than not, the response we receive is either “we didn’t do anything” or “we can’t remember”. The “we didn’t do anything” response is usually because it wasn’t felt that any change which had been made would directly impact site or channel performance.
Both responses are okay, as with some digging, we can normally identify a few potential causes. Fortunately, Google Analytics has a feature that can help pinpoint these causes, and if used often and properly, will provide a robust history of your analytics data for similar situations.
Why Annotate your data?

Annotations themselves, are small notes, quite similar in size to a tweet, at 160 characters in length, and can be added most of the reporting graphs in Google Analytics.
This may seem to be insubstantial, it might not be immediately necessary to know small changes you made yesterday to your site or marketing channels, being so fresh in the mind. However, come 6 months down the line, you may look back and wonder what exactly you did to boost traffic at that time.
Knowing exactly what actions you performed, or what events took place, could help remind you of effective methods used to boost your traffic and conversions, or point out a change that could still be affecting your current traffic and conversions to this day.
Aside from small changes, annotations can also be used to record major events, even if those events don’t appear initially to directly relate to your website or data. An example would be a shift in the industry, which could affect your business on a whole, or just sales, either of which could affect your business, and could gradually impact on traffic and conversion levels within Google Analytics.
Recently, we had the general election, which could have caused a dip in traffic and conversion on your site just before and after election day. Depending on policy changes and who won, you may also find a longer term impact on traffic. In that case, it would be helpful to look back and see an annotation as a reminder.
Overall, using annotations will provide you with a timeline of events, and their consequences, both direct and indirect, which will give you invaluable data to identify trends, effective decisions made and equally, ineffective decisions, that could be avoided in the future.
Creating your own Annotations

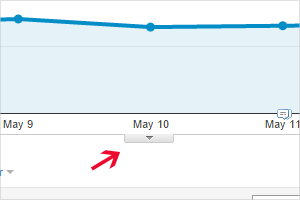
Annotations are a feature of the Graph View within Google Analytics, quite subtly hidden at the bottom edge.
Clicking on this tab will expand the annotation view, to show a list of all current annotations that have been created. These are very easy and quick to create, are fully editable once written, and are simple to delete if you decide that some notes are no longer relevant or important to you. Once you are done, the annotations tab can simply be closed again, keeping your Graph View clean and tidy, and neatly annotated at points of interest.
Public or Private?
Every annotation that you make can be set with a level of scope, making it publicly viewable, or privately viewable only to you. This can provide an extra level of security, or just to take personal notes within the annotations, if you are sharing access with other people.
So remember and take note (with an Annotation)
We find annotations incredibly useful for any kind of business that wants to use analytics effectively. Let us know your thoughts, if you have used (or haven’t used!) annotations for yourself.
You can find a full list of the features of annotations here: https://www.google.com/intl/en_uk/analytics/features/annotations.html


