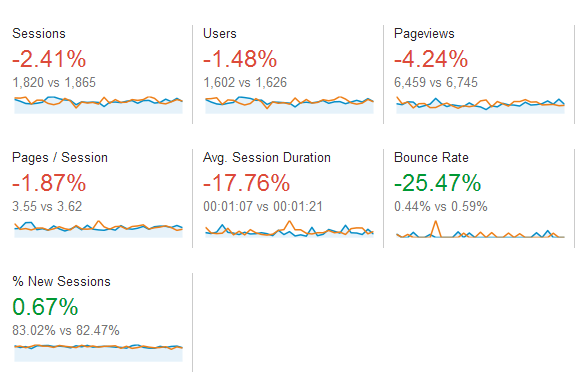
Google Analytics provides you with much needed website information & data. While most of the time, you’ll be interested in your current data, how things are right now at this very moment, an entire history is kept within Google Analytics. It would be a shame to waste this information after being recorded, so what can we do with it?
Measure performance and spot trends of course.
Google Analytics (and AdWords) comes with a wonderful piece of equipment, called the Date Comparison Tool. This allows you to compare information from one time period with the information from another, and see what differences are involved, what has changed, and determine how well your website & adverts have been performing.
What is the tool?
The Tool itself is located at the top right of your Google Analytics, and allows you to choose a date range to view your data. You can select a date range normally, to see a subset of your information (based on a start date, and end date), from a list of presets provided to you by Google, or you can select a set of custom dates, like below.

You may spot there a little box, called “Compare”. This is the crux of the tool, as selecting it will allow you to add a second date range.

Once activated, Google Analytics will compare these date ranges together, and display their differences. The normal information for the date ranges is still displayed also, but for the ease of comparing this information, the changes are highlighted.

So why use it?
So why bother with information from the past, that you perhaps have already seen? Well, we don’t always have the best memory, and remembering individual statistics from the past would prove difficult. By viewing this information by comparison, you can spot improvements or declines in your performance, as well as see any annotations noting changes in the past that you may have made. It is also possible to use this comparison data to make predictions. If your data from one month of the year is similar to last year, a prediction could be made for the next month based on the previous year as well. If the services your business offers are seasonal, you can compare entire seasons at a time with each other, to judge how well you have been performing.

Wrap Up
In the end, the Date Comparison Tool is used to make your website & adverts work more efficiently, by checking their performance and trends, and identifying where you can improve. Knowing what you did in the past (even if you don’t remember it!) can help solve tricky issues, such as a sudden drop in sessions. If it happened last month as well, you could see why and plan accordingly to avoid a repeat if possible. The Date Comparison Tool can give you an idea of what to expect!


